K8S集群内部署Filebeat
ClusterRole与SA
---
apiVersion: rbac.authorization.k8s.io/v1beta1
kind: ClusterRoleBinding
metadata:
name: filebeat
subjects:
- kind: ServiceAccount
name: filebeat
namespace: ops
roleRef:
kind: ClusterRole
name: filebeat
apiGroup: rbac.authorization.k8s.io
---
apiVersion: rbac.authorization.k8s.io/v1beta1
kind: ClusterRole
metadata:
name: filebeat
labels:
app: filebeat
rules:
- apiGroups: [""]
resources:
- namespaces
- pods
verbs:
- get
- watch
- list
---
apiVersion: v1
kind: ServiceAccount
metadata:
name: filebeat
namespace: ops
labels:
app: filebeat
|
ConfigMap
apiVersion: v1
kind: ConfigMap
metadata:
name: filebeat-config
namespace: ops
labels:
app: filebeat
data:
filebeat.yml: |-
filebeat.inputs:
- type: log
symlinks: true
enabled: true
json.keys_under_root: false # keys_under_root可以让字段位于根节点,默认为false
json.overwrite_keys: false # 对于同名的key,覆盖原有key值
json.add_error_key: true # 将解析错误的消息记录储存在error.message字段中
tail_files: true # 如果此选项设置为true,Filebeat开始在每个文件的末尾读取新文件,默认设置是false。
paths:
- /var/log/containers/*.log
exclude_files:
- 'ingress-nginx-controller\.*'
processors:
- drop_event:
when:
or:
- regexp:
json.log: '定时任务'
- regexp:
json.log: 'Go-http-client'
fields:
log_topic: k8s-pod-logs
type: "kube-logs"
- type: log
symlinks: true
enabled: true
json.keys_under_root: true
json.overwrite_keys: true
json.add_error_key: true
tail_files: true
paths:
- /var/log/containers/ingress-nginx-controller*.log
processors:
- decode_json_fields:
fields: ['log']
target: ""
overwrite_keys: false
process_array: false
max_depth: 1
- drop_event:
when:
or:
- regexp:
http_user_agent: 'Go-http-client'
fields:
log_topic: "ingress-k8s"
type: "ingress"
filebeat.config.modules:
path: ${path.config}/modules.d/*.yml
reload.enabled: false
setup.template.settings:
index.number_of_shards: 1
output.kafka:
enabled: true
hosts: ["xx.xx.xx.xx:9092","xx.xx.xx.xx:9092","xx.xx.xx.xx:9092"]
topic: '%{[fields.log_topic]}'
partition.round_robin:
reachable_only: false
required_acks: 1
compression: gzip
max_message_bytes: 100000000000
processors:
- add_host_metadata: ~
- add_cloud_metadata: ~
|
需要重点注意的是:
- fileds块:设置一些字段,这里设置的是
log_topic,在output.kafka中设置了kafka的topic就是log_topic的值。
- processors块:设置处理器,这里设置了两种processor,一个是drop_event,用于去除包含某些值的日志,一个是decode_json_fields,用于解码json字段。这两个processor都是logstash自带的
Processor参考:https://www.elastic.co/guide/en/beats/filebeat/current/filtering-and-enhancing-data.html
Daemonset
apiVersion: apps/v1
kind: DaemonSet
metadata:
name: filebeat
namespace: ops
labels:
app: filebeat
spec:
selector:
matchLabels:
app: filebeat
template:
metadata:
labels:
app: filebeat
spec:
serviceAccountName: filebeat
terminationGracePeriodSeconds: 30
hostNetwork: true
dnsPolicy: ClusterFirstWithHostNet
containers:
- name: filebeat
imagePullPolicy: IfNotPresent
image: registry.cn-hangzhou.aliyuncs.com/yaml/images:filebeat-7.3.2
args: ["-c", "/etc/filebeat.yml","-e",]
securityContext:
runAsUser: 0
resources:
limits:
cpu: 300m
memory: 200Mi
requests:
cpu: 200m
memory: 100Mi
volumeMounts:
- name: config
mountPath: /etc/filebeat.yml
readOnly: true
subPath: filebeat.yml
- name: data
mountPath: /usr/share/filebeat/data
- name: container-dir
mountPath: /var/lib/docker/containers
readOnly: true
- name: log-dir
mountPath: /var/log
readOnly: true
tolerations:
- key: "apptype"
operator: "Exists"
effect: "NoSchedule"
volumes:
- name: config
configMap:
defaultMode: 0600
name: filebeat-config
- name: container-dir
hostPath:
path: /var/lib/docker/containers
- name: log-dir
hostPath:
path: /var/log
- name: data
hostPath:
path: /var/lib/filebeat-data
type: DirectoryOrCreate
|
Logstash配置
Logstash也部署在K8S集群内,对于Pod日志消费和Ingress日志消费,启用不同的logstash实例。
Pod日志处理
ConfigMap
apiVersion: v1
kind: ConfigMap
metadata:
name: logstash-pod-logs
namespace: ops
data:
jvm.options: |
# -Xms2g
# -Xmx3g
-XX:+UseConcMarkSweepGC
-XX:CMSInitiatingOccupancyFraction=75
-XX:+UseCMSInitiatingOccupancyOnly
-Djava.awt.headless=true
-Dfile.encoding=UTF-8
-Djruby.compile.invokedynamic=true
-Djruby.jit.threshold=0
-Djruby.regexp.interruptible=true
-XX:+HeapDumpOnOutOfMemoryError
-Djava.security.egd=file:/dev/urandom
logstash.yml: |
http.host: "0.0.0.0"
path.config: /usr/share/logstash/pipeline
pipeline.id: "pod-logs"
xpack.monitoring.enabled: true
xpack.monitoring.elasticsearch.username: logstash_system
xpack.monitoring.elasticsearch.password: "xxxxxxxxxx"
xpack.monitoring.elasticsearch.hosts: ["http://xx.xx.xx.xx:9200", "http://xx.xx.xx.xx:9200","http://xx.xx.xx.xx:9200"]
logstash.conf: |
input {
kafka {
bootstrap_servers => "xx.xx.xx.xx:9092,xx.xx.xx.xx:9092,xx.xx.xx.xx:9092"
topics => ["k8s-pod-logs"] # 对应上面filebeat中对应的kafka topic配置 topic: '%{[fields.log_topic]}'
codec => "json"
consumer_threads => 3
group_id => "k8s_group"
decorate_events => true
type => "logstash_mixins"
}
}
filter{
mutate {
rename => ["[json][log]", "message"]
rename => ["[host][name]", "hostname"]
add_field => { "log_path" => "%{log}" }
remove_field => ["[fields][log_topic]"]
remove_field => ["ecs","@version","input","host","agent","json","log"]
}
grok {
match => {"log_path" => "/var/log/containers/%{DATA:pod_name}_%{DATA:namespace}_%{GREEDYDATA:app}-%{DATA:container_id}.log"}
remove_field => "log_path"
}
}
output {
if [type] == "logstash_mixins" {
elasticsearch {
action => "index"
hosts => ["xx.xx.xx.xx:9200","xx.xx.xx.xx:9200","xx.xx.xx.xx:9200"]
index => "%{[namespace]}-%{[app]}-%{+YYYY.MM.dd}"
user => "elastic"
password => "xxxxxxxxxx"
}
}
}
|
关于xpack.monitoring的配置可以不配,仅仅是多了对es、kibana、logstash基础信息的监控。
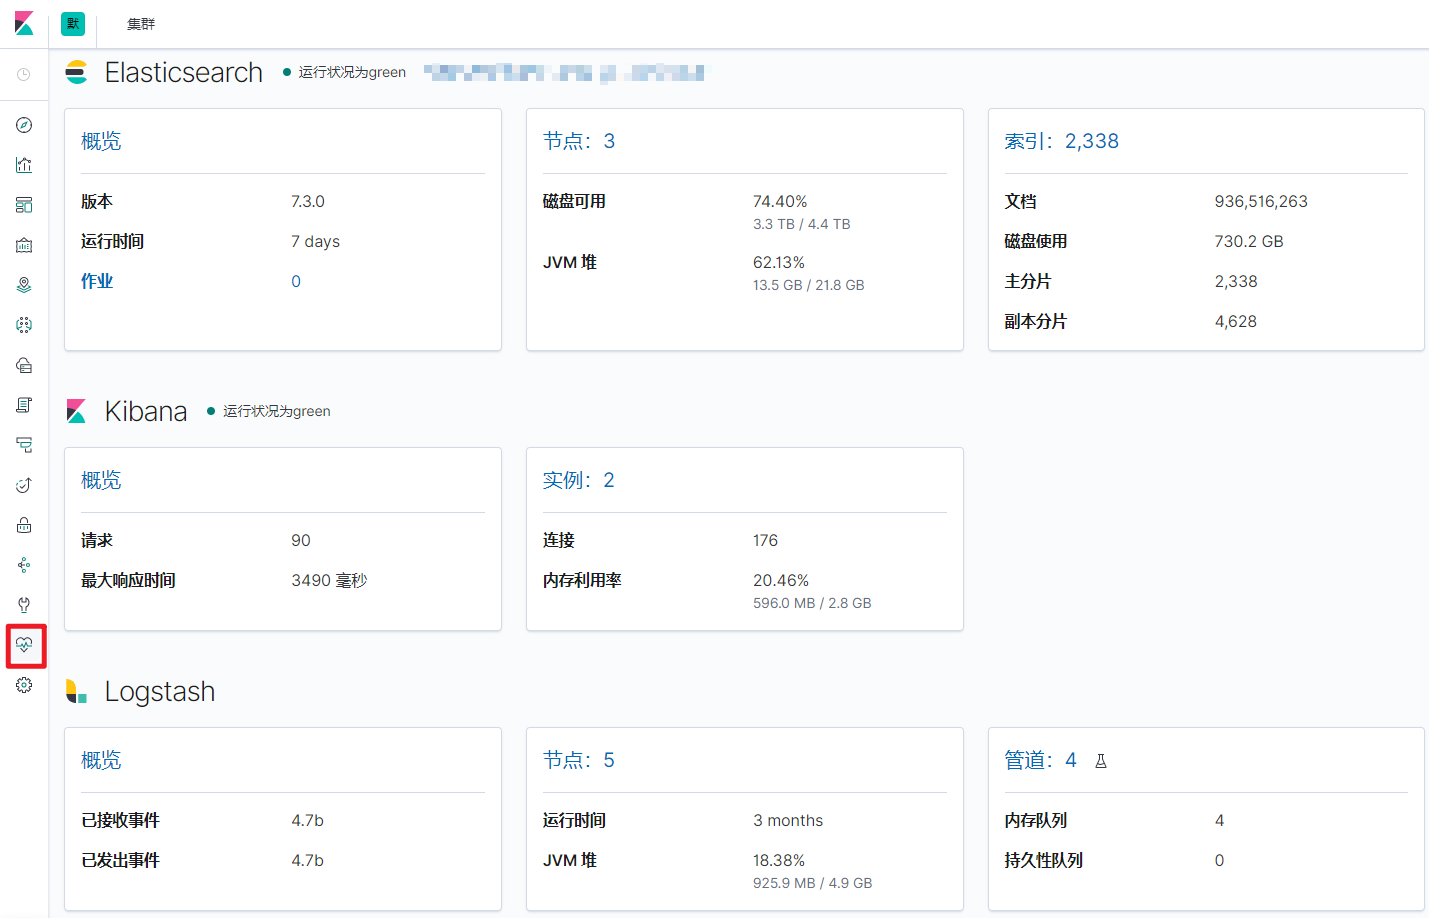
与此关联的es索引为
.monitoring-kibana开头的,对应kibana的信息.monitoring-logstash开头的,对应logstash的信息.monitoring-es开头的,对应es的信息
Deployment
apiVersion: apps/v1
kind: Deployment
metadata:
  name: logstash-pod-logs
  namespace: ops
spec:
  replicas: 1
  selector:
    matchLabels:
      app: logstash-pod-logs
  template:
    metadata:
      labels:
        app: logstash-pod-logs
    spec:
      containers:
      - name: logstash
        image: logstash:7.16.2
        ports:
        - containerPort: 5044
        volumeMounts:
          - name: logstash-pod-logs-config
            mountPath: /usr/share/logstash/config
          - name: logstash-pod-logs-pipeline-config
            mountPath: /usr/share/logstash/pipeline
        resources:
            limits:
              memory: "4Gi"
              cpu: "2"
            requests:
              memory: "4Gi"
              cpu: "2"
      volumes:
      - name: logstash-pod-logs-config
        configMap:
          name: logstash-pod-logs
          items:
            - key: logstash.yml
              path: logstash.yml
            - key: jvm.options
              path: jvm.options
      - name: logstash-pod-logs-pipeline-config
        configMap:
          name: logstash-pod-logs
          items:
            - key: logstash.conf
              path: logstash.conf
|
Ingress-Nginx日志处理
ConfigMap
apiVersion: v1
kind: ConfigMap
metadata:
  name: logstash-ingress-nginx
  namespace: ops
data:
  jvm.options: |
    # -Xms2g
    # -Xmx3g
    -XX:+UseConcMarkSweepGC
    -XX:CMSInitiatingOccupancyFraction=75
    -XX:+UseCMSInitiatingOccupancyOnly
    -Djava.awt.headless=true
    -Dfile.encoding=UTF-8
    -Djruby.compile.invokedynamic=true
    -Djruby.jit.threshold=0
    -Djruby.regexp.interruptible=true
    -XX:+HeapDumpOnOutOfMemoryError
    -Djava.security.egd=file:/dev/urandom
  logstash.yml: |
    http.host: "0.0.0.0"
    path.config: /usr/share/logstash/pipeline
    pipeline.id: "ingress-nginx"
    xpack.monitoring.enabled: true
    xpack.monitoring.elasticsearch.username: logstash_system
    xpack.monitoring.elasticsearch.password: "xxxxxxxxxx"
    xpack.monitoring.elasticsearch.hosts: ["http://xx.xx.xx.xx:9200", "http://xx.xx.xx.xx:9200","http://xx.xx.xx.xx:9200"]
  logstash.conf: |
    input {
      kafka {
        bootstrap_servers => "xx.xx.xx.xx:9092,xx.xx.xx.xx:9092,xx.xx.xx.xx:9092"
        topics => ["ingress-k8s"]
        group_id => "k8s_group"
        codec => "json"
        consumer_threads => 3
        decorate_events => true
        type => "logstash_mixins"
      }
    }

    filter{
        mutate{
            rename => ["[host][name]", "hostname"]
            remove_field => ["ecs","@version","input","host","agent","log"]
        }
    }

    output {
      elasticsearch {
          action   => "index"
          hosts    => ["xx.xx.xx.xx:9200","xx.xx.xx.xx:9200","xx.xx.xx.xx:9200"]
          index    => "%{[fields][type]}-%{+YYYY.MM.dd}"
          user     => "elastic"
          password => "xxxxxxxxxxxxxxxxxxxx"
      }
    }
|
deployment 与上面类似,只要替换掉configmap的名称以及deployment的名称即可。


